Anomalies

August 2024 – Temperature

A lot of strange goings on in mean temperature anomalies for August across this part of the northern hemisphere. One of them was a belt of colder than average temperatures that extended from the central Asia southwest across Pakistan, and then on westward across sub Saharan Africa. Another was the more intense pockets of cold air across British Columbia and Iceland. The North Atlantic was a little colder than average north of 55N, but much warmer than that to the south (+2C), the UKUK The United Kingdom of Great Britain and Northern Ireland, commonly known as the United Kingdom (UK) or Britain, is a country in Europe, off the north-western coast of the continental mainland. It comprises England, Scotland, Wales and Northern Ireland. again ending up sandwiched again in a NW-SE temperature gradient.

Anomalies, August, Global Temperatures

August 2024 – Temperature Read More »

July 2024 – Temperature Anomalies

Mean temperatures across the British Isles were close to the LTALTA Long Term Average. This is usually defined as a 30 year period by the WMO.. Much of the North Atlantic was warm (+3C) south of 55N, but a band of colder temperatures extended from Baffin Island (-5C) in the west to southern Scandinavia (-1C) in the east. Meanwhile the north of Scandinavia was warm (+3C), likewise SE Europe around Bulgaria was also very warm (+4C).

Anomalies, Global Temperatures, Temperature

July 2024 – Temperature Anomalies Read More »

July 2024 – MSLP

Pressure was lower (-3 hPahPa A Hectopascal is the SI unit of pressure and identical to the Millibar) close to the Azores during July, with higher than average pressure to the west this displaced the usual Azores high further west in the North Atlantic. This, combined with much lower than average across Greenland and Iceland, resulted in a fairly strong mean zonal W’SW flow across the Atlantic for the time of year, running from Canada to the Baltic across the British Isles.

Anomalies, July, MSLP

July 2024 – MSLP Read More »

June 2024 – Mean Pressure and anomalies

Much lower than average pressure to the north (-8 hPahPa A Hectopascal is the SI unit of pressure and identical to the Millibar), and higher than average pressure in the central Atlantic (+5 hPa), produced a W’NW flow and lower than average temperatures across IONAIONA Islands Of North Atlantic. Yes I know there's an island called Iona, but this is so I don't have to use the term 'British Isles' when referring to the whole of Ireland and the UK..

Anomalies, June, MSLP

June 2024 – Mean Pressure and anomalies Read More »

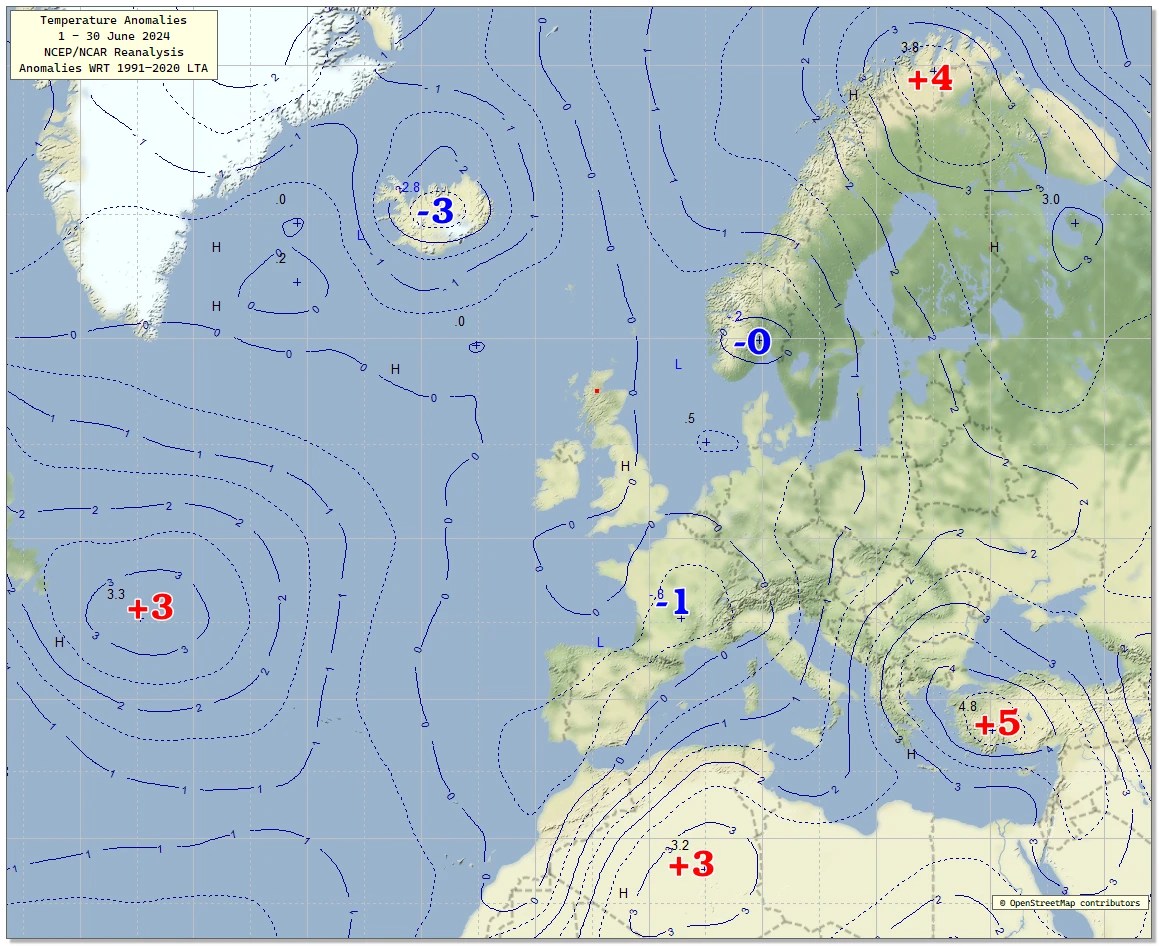
June 2024 – Mean Temperature anomalies

Mean temperatures were close to or a little below average across IONAIONA Islands Of North Atlantic. Yes I know there's an island called Iona, but this is so I don't have to use the term 'British Isles' when referring to the whole of Ireland and the UK.. A cold trough extended SSE from central Greenland, through Iceland and on into Iberia and southern France. Warmer than average air dominated the central Atlantic, and in a band running from northern Scandinavia, down into eastern Russia, Turkey and on into north Africa.

Anomalies, Global Temperatures, June

June 2024 – Mean Temperature anomalies Read More »

April 2024 – MSLP

The resident Icelandic low for April was displaced southeastward again this month by higher than average pressure across Greenland, and lower than average pressure in the northern North Sea, leaving the British Isles in a slack cyclonic westerly flow on the mean pressure chart.

Anomalies, April, MSLP

April 2024 – MSLP Read More »

Spring 2024 – Abnormal warmth in central Europe

Is it possible to get a heatwave in Spring? I beleive it is, and it seems to have already happened at least once since the start of astronomical spring in central Europe. I reckon that maximum temperatures anomalies of 10°C above the LTALTA Long Term Average. This is usually defined as a 30 year period by the WMO. constitute a heatwave day. The definition of a heatwave of course is that these high temperatures should occur for at least three consecutive days or more. So the charts I’ve constructed are just a simple count of days with anomalies higher than 10°C. I’ve not any deep research into this, but have just added a chart for 2023 for a comparison. I think, like a lot of others do, that with global surface temperatures and North Atlantic SSTSST Sea Surface Temperatures being at unprecedented high levels as they are at present this is portentous, and summer across mainland Europe could see a record number of severe heatwave events and the risks that this brings. Hopefully I’m proved wrong, and surges of warm air flooding up from the tropics won’t occur too frequently.

Anomalies, Europe, Global Temperatures, Heatwave

Spring 2024 – Abnormal warmth in central Europe Read More »

A bar chart that shows both temperature and anomaly

For people who can’t get their heads around anomalies I’ve made a slight variation on just a simple bar chart of anomalies. The twist is that it now displays both daily temperatures and anomalies, temperatures on the left Y axis and anomalies on the right Y axis. My BBCBBC The British Broadcasting Corporation (BBC) is the national broadcaster of the United Kingdom, based at Broadcasting House in London. It is the world's oldest national broadcaster, and the largest broadcaster in the world by number of employees, employing over 22,000 staff in total, of whom approximately 19,000 are in public-sector broadcasting. NWPNWP Numerical weather prediction uses mathematical models of the atmosphere and oceans to predict the weather based on current weather conditions. application downloads forecast data the BBC use in their own weather app, and parses the HTML and extracts hourly and daily forecast values for each site. I’ve kept the same scale for the extremes in each charts Y axis for each site I display in the grid to aid comparison. So you can now quickly see at a glance the forecast temperature and how it compares with the LTALTA Long Term Average. This is usually defined as a 30 year period by the WMO..

Anomalies, BBC, Software, Temperature

A bar chart that shows both temperature and anomaly Read More »

February 2024 – Temperature

2024 saw an exceptionally mild February across much of Europe, the warmth centred across the eastern Alps (+7°C). It was a little colder than average across to the northwest of Iceland (-2°C), which help produce a tight SE-NW temperature gradient across the IONAIONA Islands Of North Atlantic. Yes I know there's an island called Iona, but this is so I don't have to use the term 'British Isles' when referring to the whole of Ireland and the UK. which and was evident for much of the month. It wasn’t just Europe that was very mild, much of North America, away from the extreme west, was also anomalously warm (+6°C) during February.

Anomalies, Temperature

February 2024 – Temperature Read More »

January 2024 | Circulation

Temperatures across IONAIONA Islands Of North Atlantic. Yes I know there's an island called Iona, but this is so I don't have to use the term 'British Isles' when referring to the whole of Ireland and the UK. were close to average in January. I suspect the mean MSLPMSLP Mean sea level pressure is the pressure at sea level, or, when measured at a given elevation on land, the station pressure reduced to sea level assuming an isothermal layer at the station temperature. chart is not telling us the full story, because with a mean flow like this, you might have expected temperatures to have been well above average.

If you turn up the granularity the pentad mean pressure charts reveals why January wasn’t much milder. The 7th to 11th was cold and anticyclonic, the 12th to 16th NW’ly and the 17th to 31st was a milder W or SW’ly.

Anomalies, Circulation, January, MSLP

January 2024 | Circulation Read More »

3 January 2024 – Temperature anomalies

The cold air across Scandinavia still won’t relinquish its hold in early January, and we are left with a topsy-turvy anomaly chart, with a belt of warm anomalous air extending from the Atlantic, northeastward across Iceland and into the Arctic Ocean. Either side of this belt of very mild air, across northern Europe and Greenland, anomalies are as low as -17°C in Finland, and -22°C in western Russia. The paradox is that globally, temperatures are still at record high levels never seen before, well at least since 1850 when records started.

Anomalies, Global Temperatures

3 January 2024 – Temperature anomalies Read More »

UK Precipitation – 2023

Using the UKPUKP UKP is a gridded datasets of UK regional precipitation. daily rainfall data from the UKMOUKMO The Meteorological Office is the United Kingdom's national weather service. It is an executive agency and trading fund of the Department for Business, Energy and Industrial Strategy it looks like Northern Scotland has still the lowest POAPOA Percentage Of Average of all Regions In the UKUK The United Kingdom of Great Britain and Northern Ireland, commonly known as the United Kingdom (UK) or Britain, is a country in Europe, off the north-western coast of the continental mainland. It comprises England, Scotland, Wales and Northern Ireland. at 103.7%. The line series in the graph for the other regions in the UK are more amplified and wetter, with the Central region of England having the highest 133.4% POA. This time last year Central region were ~87%. It looks like 2023 started close to average and just steadily got wetter.

Anomalies, Precipitation

UK Precipitation – 2023 Read More »

Global Temperatures – December 2023

With large parts of the world anomalously warm, the cold belt stretching from Greenland, across Scandinavia and on eastward into Siberia and China persisted. In the UKUK The United Kingdom of Great Britain and Northern Ireland, commonly known as the United Kingdom (UK) or Britain, is a country in Europe, off the north-western coast of the continental mainland. It comprises England, Scotland, Wales and Northern Ireland. this cold belt to the north enhanced the N-S thermal gradient, thanks in no small part to a warm tongue of positive anomalies extending NW from the Balkans, no doubt the result of the many warm sectors that affected southern areas of the UK during the month. Temperature anomalies of 9°C above the LTALTA Long Term Average. This is usually defined as a 30 year period by the WMO. across North America were nothing short of extraordinary.

Anomalies, December, Global Temperatures

Global Temperatures – December 2023 Read More »

November 2023 – Mean Pressure

In November it looks like the semi-permanent Icelandic low decided to do some early Christmas shopping and head southeast towards Scotland. Thanks to blocking, from Greenland across to northern Scandinavia, for much of the month, anomalies were low from Denmark to eastern Russia (-12 hPahPa A Hectopascal is the SI unit of pressure and identical to the Millibar) and higher (+8 hPa) to the northeast of Iceland. Much of the cyclonic activity in the first half of the month took place at latitude 50° north, the North Atlantic’s answer to the roaring forties. 😉

Here’s a closer look at the daily charts and associated LWTLWT Lamb Weather Types are often used in UK-based analyses, with individual weather patterns based on the eight primary cardinal directions (N, NE, E, SE, S, SW, W, NW) plus cyclonic (C), anticyclonic (A) and unclassified (U) types. and GIGI Gale Index.

Anomalies, MSLP, November

November 2023 – Mean Pressure Read More »

October 2023 – Mean temperature Anomalies

Another very warm month across the Arctic. Warm in S Europe & NENE North East America, but rather cold across Central N America and Scandinavia.
North-south temperature gradient very evident across the UKUK The United Kingdom of Great Britain and Northern Ireland, commonly known as the United Kingdom (UK) or Britain, is a country in Europe, off the north-western coast of the continental mainland. It comprises England, Scotland, Wales and Northern Ireland..

Anomalies, Temperature

October 2023 – Mean temperature Anomalies Read More »

The rather cold summer of 2023 in Iceland

One country in Europe that’s bucked the trend of a warm summer in 2023 was Iceland. I’ve noticed this in the monthly anomaly charts for mean temperature that I produce, so I decided to spruce up my chart grid viewer to see if I was right in my assumption, and as you can see in this chart of weekly mean anomalies I was. What caused it is may have been persistent high pressure across the Greenland ice cap to the northwest of Iceland, and a shift southward of the Icelandic low, which in turn allowed more days of northerly or north-westerly flows and hence the lower than average temperatures.

It’s not easy to verify these findings because even the Icelandic Met OfficeUKMO The Meteorological Office is the United Kingdom's national weather service. It is an executive agency and trading fund of the Department for Business, Energy and Industrial Strategy site offers no real clues to how they categorised this summer’s temperatures. If you’re by any chance reading this in Iceland, please let me know how you found it😉

Anomalies, Iceland, Software, Temperature

The rather cold summer of 2023 in Iceland Read More »

September 2023 – When anomaly charts hide the real picture

I was watching the Deep Dive video produced by the UKMOUKMO The Meteorological Office is the United Kingdom's national weather service. It is an executive agency and trading fund of the Department for Business, Energy and Industrial Strategy, and presented so well by Alex Deakin about the weather in September 2023 on Youtube as you do. He showed two anomaly charts for MSLPMSLP Mean sea level pressure is the pressure at sea level, or, when measured at a given elevation on land, the station pressure reduced to sea level assuming an isothermal layer at the station temperature., one for the first half of September and the other for the second half that showed how anomaly charts for the whole month can sometimes be misleading. In this case it was how the remarkable warm spell in the first half of the month contrasted with the more mobile second half. The resulting anomaly chart for the whole of the September cancelled out the anticyclonic SE’ly in the first half that brought all the high temperatures.

Anomalies, MSLP, September, Temperature

September 2023 – When anomaly charts hide the real picture Read More »

Scroll to Top