Global Temperatures

January 2025 – Record warm month globally

I make the anomaly for January +1.75°C above the pre-industrial LTALTA Long Term Average. This is usually defined as a 30 year period by the WMO., which makes it the warmest January in the series, which started in 1940. It surprised some people, but if you watch the daily values, it was always on the cards. 😉 Of course with a La NinaLa Niña La Niña is an oceanic and atmospheric phenomenon that is the colder counterpart of El Niño, as part of the broader El Niño–Southern Oscillation climate pattern. The name La Niña originates from Spanish for "the girl", by analogy to El Niño, meaning "the boy". In the past, it was also called an anti-El Niño[1] and El Viejo, meaning "the old man." just starting in the Pacific, most people thought that 2025 would end up being cooler than 2024, obviously the warmer than average oceans away from the central Pacific, and which drive global temperatures, have other ideas. 😮

Global Temperatures, Global Warming, January

January 2025 – Record warm month globally Read More »

January 2025 – Temperature anomalies

An exceptionally mild January across northern Quebec (+13°C), much colder further south across the southern United States (-4°C). Europe, particularly further east, was very mild with a large area of warm anomalies (+6°C) centred across eastern Russia. Anomalies across the Atlantic were generally closer to average, but it was slightly warmer than average to the east of Iberia, and slightly colder to the north of Iceland.

Anomalies, Global Temperatures, January

January 2025 – Temperature anomalies Read More »

December 2024 – Temperature Anomalies

A bridge between two large positive temperature anomalies, one in the west of in Hudson Bay (+11°C), the other in the east in the Kara Sea (+7°C), spanned the North Atlantic in December. Either side was generally cooler, Southern Greenland was anomalously cold (-5°C), as was much of the southern North Atlantic, Mediterranean and near East. Anomalies across IONAIONA Islands Of North Atlantic. Yes I know there's an island called Iona, but this is so I don't have to use the term 'British Isles' when referring to the whole of Ireland and the UK. in the bridge were a toasty +1.6°C above the LTALTA Long Term Average. This is usually defined as a 30 year period by the WMO..

Anomalies, December, Global Temperatures

December 2024 – Temperature Anomalies Read More »

Globally 2024 warmest on record +1.6°C above the pre-industrial era

I make the mean global temperature anomaly in 2024 a full 1.6°C above the LTALTA Long Term Average. This is usually defined as a 30 year period by the WMO. in pre-industrial times. This is warmest year in the series which started in 1940, and is around 0.12°C warmer than it was in 2023. If it warms at the same rate as it’s done over the last 30 years, linear trends suggest that a 30 year average of +1.5°C will occur in just over five years time, in July 2030.

Global Temperatures, Global Warming

Globally 2024 warmest on record +1.6°C above the pre-industrial era Read More »

Global Temperatures – December 2024

I make December 2024, using ERA5ERA ERA stands for 'ECMWF Re-Analysis' and refers to a series of research projects at ECMWF which produced various datasets (ERA-Interim, ERA-40, etcetera). daily global temperature data, the second warmest globally in the series that starts in 1940. Mean anomalies were just under 1.7°C degrees above the pre-industrial LTALTA Long Term Average. This is usually defined as a 30 year period by the WMO., and close to 0.1°C lower than they were in December 2023.

Global Temperatures

Global Temperatures – December 2024 Read More »

Global Temperatures – November 2024

Using my DIYDIY Do It Yourself global temperature series that I glean from the NOAANOAA NOAA is an agency in the Department of Commerce that maps the oceans and conserves their living resources; predicts changes to the earth's environment; provides weather reports and forecasts floods and hurricanes and other natural disasters related to weather. reanalysis data I download, I make the mean temperature for November 2024 9.73°C, this is lower than the 9.81°C of November 2023 by 0.08°C, which doesn’t look a lot, but when it comes to global temperatures it’s really quite large. The recent surge in global temperatures over the last two years has now peaked, as can be seen in the 365 day moving average. Where it goes in the coming year is anyone’s guess and dependent on ENSOENSO El Niño–Southern Oscillation is an irregular periodic variation in winds and sea surface temperatures over the tropical eastern Pacific Ocean, affecting the climate of much of the tropics and subtropics. The warming phase of the sea temperature is known as El Niño and the cooling phase as La Niña. and the SSTSST Sea Surface Temperatures in the world’s oceans which are currently still close to record levels.

Global Temperatures, Global Warming

Global Temperatures – November 2024 Read More »

+1.5°C in less than five years

The 30 year average of ERA5ERA ERA stands for 'ECMWF Re-Analysis' and refers to a series of research projects at ECMWF which produced various datasets (ERA-Interim, ERA-40, etcetera). global temperature anomalies will reach +1.5°C above the 1850-1900 pre-industrial age by the 27th of October 2029. That’s what an extrapolation forward of a linear trend for the last 30 years daily anomalies indicates. The daily series has already had values over +2.0°C in the last year, and the estimated annual mean for 2024 (as of 30 November) already stands at +1.59°C. The 30 year mean is important because 30 years is the period that the WMOWMO The World Meteorological Organisation is a specialized agency of the United Nations responsible for promoting international cooperation on atmospheric science, climatology, hydrology and geophysics. use for climatological averages.

Global Temperatures

+1.5°C in less than five years Read More »

Is there a four year cycle in global temperatures?

Is there a four year cycle in global temperatures? The short answer to that question is probably not. But the last three well defined peaks in the 12 monthly average in 2016, 2020 and 2024, do fit very nicely with the idea of four year cycle. Before that you have to twist the theory quite a bit to find another vague, but much less well defined series, with the years 1998, 2002, 2006 & 2010.

Global Temperatures, Singularity

Is there a four year cycle in global temperatures? Read More »

October 2024 – ERA5 Global Temperatures

The global temperature estimates made by the ECMWFECMWF The European Centre for Medium-Range Weather Forecasts is an independent intergovernmental organisation supported by most of the nations of Europe. It is based at three sites: Shinfield Park, Reading, United Kingdom; Bologna, Italy; and Bonn, Germany. It operates one of the largest supercomputer complexes in Europe and the world's largest archive of numerical weather prediction data. in the ERA5ERA ERA stands for 'ECMWF Re-Analysis' and refers to a series of research projects at ECMWF which produced various datasets (ERA-Interim, ERA-40, etcetera). series show that October 2024 was the second warmest in the short series back to 1948. I’m quite glad about that, because my DIYDIY Do It Yourself reanalysis series which I maintain showed the same thing. What is more astounding about October’s temperatures though, is that a 30 year linear trend on the ERA5 data shows a whopping 0.313°C decadal rise in global temperatures. If this were typical for all months of the year you can forget about limiting the increase in warming to only 1.5°C, it would be more like 3°C.😮

ECMWF, Global Temperatures, Global Warming, October

October 2024 – ERA5 Global Temperatures Read More »

Oct 2024 – Global Temperature

The cold theme continued across southern Greenland & Iceland during October. It was particularly warm across Arctic Canada and to the north of Franz Józef Land in the Arctic ocean (+12°C), central parts of the United States where also much warmer than average (+5°C). Europe was generally 1-3 degrees above average. Spot my deliberate mistake in anomalies across Africa, if I had more than 14 subscribers I would bother to fix it. 😜

Globally, October 2024 was the second warmest in my DIYDIY Do It Yourself reanalysis series that extend back to 1948, fractionally behind 2023.

The daily mean global temperature has just overtaken those in October last year once again, setting more new daily records. Even without an El NinoEl Niño El Niño 'The Boy' is the warm phase of the El Niño–Southern Oscillation and is associated with a band of warm ocean water that develops in the central and east-central equatorial Pacific, the globe still continues to steadily warm. ☹

Global Temperatures, October

Oct 2024 – Global Temperature Read More »

The reason why Iceland has been so cold this month

Iceland has been rather cold for much of this year. The reason I’ve put it down to was persistent NW’ly winds flowing down from off Greenland ice cap. This month however, a tongue of colder water SSTSST Sea Surface Temperatures has extended E’NENE North East from the coast of SE Greenland and wrapped itself around Iceland’s north and east coast. You can see the effects of this if you look at temperature anomalies so far this October for Iceland. The cold month we’ve seen across much of the UKUK The United Kingdom of Great Britain and Northern Ireland, commonly known as the United Kingdom (UK) or Britain, is a country in Europe, off the north-western coast of the continental mainland. It comprises England, Scotland, Wales and Northern Ireland., and which the media love to describe as ‘rather chilly’, may also be a symptom of the colder air across Iceland and those same NW’ly winds.

How long these low SST will continue around Iceland is anyone’s guess, and what if any effect this will have on the coming winter. One thing I have noticed for some time in the long-range 16 to 30 day text forecast from the UKMOUKMO The Meteorological Office is the United Kingdom's national weather service. It is an executive agency and trading fund of the Department for Business, Energy and Industrial Strategy, is the mention of higher pressure to the northwest of the UK which might be in somehow linked.

Towards mid-November, high pressure may become more focussed towards the northwest of the UK, allowing a gradual trend towards colder and perhaps more unsettled conditions, especially in more southern and eastern areas.

UKMO
16 Oct 2024
Global Temperatures, Iceland, SST

The reason why Iceland has been so cold this month Read More »

August 2024 – Global Temperatures

After a break from being the warmest month on record in July, the ERA5ERA ERA stands for 'ECMWF Re-Analysis' and refers to a series of research projects at ECMWF which produced various datasets (ERA-Interim, ERA-40, etcetera). series is back on track. This months anomaly of +0.712°C was again the warmest on record, but just a smidgeon (0.002°C) warmer than that of August 2023 (0.71°C).

It may be another record month, but the 12 month moving average has flattened out now, after sharply rising since mid 2022. As you would expect 2023 and 2024 are also neck and neck as the highest daily anomaly on record too. It looks to me that the global temperatures we’ve experienced over the last 18 months could become the new norm despite an imminent La NinaLa Niña La Niña is an oceanic and atmospheric phenomenon that is the colder counterpart of El Niño, as part of the broader El Niño–Southern Oscillation climate pattern. The name La Niña originates from Spanish for "the girl", by analogy to El Niño, meaning "the boy". In the past, it was also called an anti-El Niño[1] and El Viejo, meaning "the old man.".

August, ECMWF, Global Temperatures

August 2024 – Global Temperatures Read More »

August 2024 – Temperature

A lot of strange goings on in mean temperature anomalies for August across this part of the northern hemisphere. One of them was a belt of colder than average temperatures that extended from the central Asia southwest across Pakistan, and then on westward across sub Saharan Africa. Another was the more intense pockets of cold air across British Columbia and Iceland. The North Atlantic was a little colder than average north of 55N, but much warmer than that to the south (+2C), the UKUK The United Kingdom of Great Britain and Northern Ireland, commonly known as the United Kingdom (UK) or Britain, is a country in Europe, off the north-western coast of the continental mainland. It comprises England, Scotland, Wales and Northern Ireland. again ending up sandwiched again in a NW-SE temperature gradient.

Anomalies, August, Global Temperatures

August 2024 – Temperature Read More »

13 month streak comes to an end

The 13 month consecutive record breaking streak in the ERA5ERA ERA stands for 'ECMWF Re-Analysis' and refers to a series of research projects at ECMWF which produced various datasets (ERA-Interim, ERA-40, etcetera). global temperature series has come to an end. The July anomaly of +0.68°C, although high, was lower than the +0.724°C of July 2023. The 12 month moving averages are also starting to show a lessening in the steepness of the rapid increase since the start of 2023. I’ve seen little mention of this news in the media which doesn’t surprise me that much. 😉

Despite being knocked off the top spot for warmest month in July, the daily global temperature for the 7th of August is still setting new records. It’s vying with 2023 for warmest and currently stands at +1.597°C above the pre-industrial LTALTA Long Term Average. This is usually defined as a 30 year period by the WMO..

Global Temperatures, July

13 month streak comes to an end Read More »

July 2024 – Temperature Anomalies

Mean temperatures across the British Isles were close to the LTALTA Long Term Average. This is usually defined as a 30 year period by the WMO.. Much of the North Atlantic was warm (+3C) south of 55N, but a band of colder temperatures extended from Baffin Island (-5C) in the west to southern Scandinavia (-1C) in the east. Meanwhile the north of Scandinavia was warm (+3C), likewise SE Europe around Bulgaria was also very warm (+4C).

Anomalies, Global Temperatures, Temperature

July 2024 – Temperature Anomalies Read More »

New daily global temperature record

The daily global temperature record was broken three times in the last week, each time by a relatively minute amount. According to the ERAERA ERA stands for 'ECMWF Re-Analysis' and refers to a series of research projects at ECMWF which produced various datasets (ERA-Interim, ERA-40, etcetera). 5 data the warmest day occurred on the 22nd of July 2024, and stands at 17.16°C, which is +1.713 above the pre-industrial LTALTA Long Term Average. This is usually defined as a 30 year period by the WMO., and well in excess of the +1.5°C threshold often quoted by the IPCCIPCC The Intergovernmental Panel on Climate Change is an intergovernmental body of the United Nations responsible for advancing knowledge on human-induced climate change. It was established in 1988 by the World Meteorological Organization and the United Nations Environment Programme, and later endorsed by United Nations General Assembly..

Climate Crisis, Copernicus, Global Temperatures

New daily global temperature record Read More »

June 2024 – Global Temperatures – 13th consecutive record month

Monthly June Anomaly

June 2024 was the 13th consecutive record warm month globally, in the ERA5ERA ERA stands for 'ECMWF Re-Analysis' and refers to a series of research projects at ECMWF which produced various datasets (ERA-Interim, ERA-40, etcetera). series that started in 1979. It was well above the record anomaly that it set in June 2023, but having said that global temperatures are now starting to slide as El NinoEl Niño El Niño 'The Boy' is the warm phase of the El Niño–Southern Oscillation and is associated with a band of warm ocean water that develops in the central and east-central equatorial Pacific starts to kick in in the central Pacific. Daily anomalies have already fallen below the magic +1.5°C mark, and 2024 might have well have a job keeping up with records set up only last summer. I would like to confidently predict that June 2024 will be the last record breaking month, but I’ve done that before, and have already lost any street cred that I may have had. 😉

Daily Anomalies

A rolling 365 day moving average of anomalies since pre-industrial times have been above 1.5ºC for all of this year. It’s currently at +1.64ºC and in its third peak since 2015. A 30 year linear trend shows that the average could reach the 1.5°C mark by late 2030.

365 Day Moving Average
ECMWF, Global Temperatures, Global Warming

June 2024 – Global Temperatures – 13th consecutive record month Read More »

June 2024 – Mean Temperature anomalies

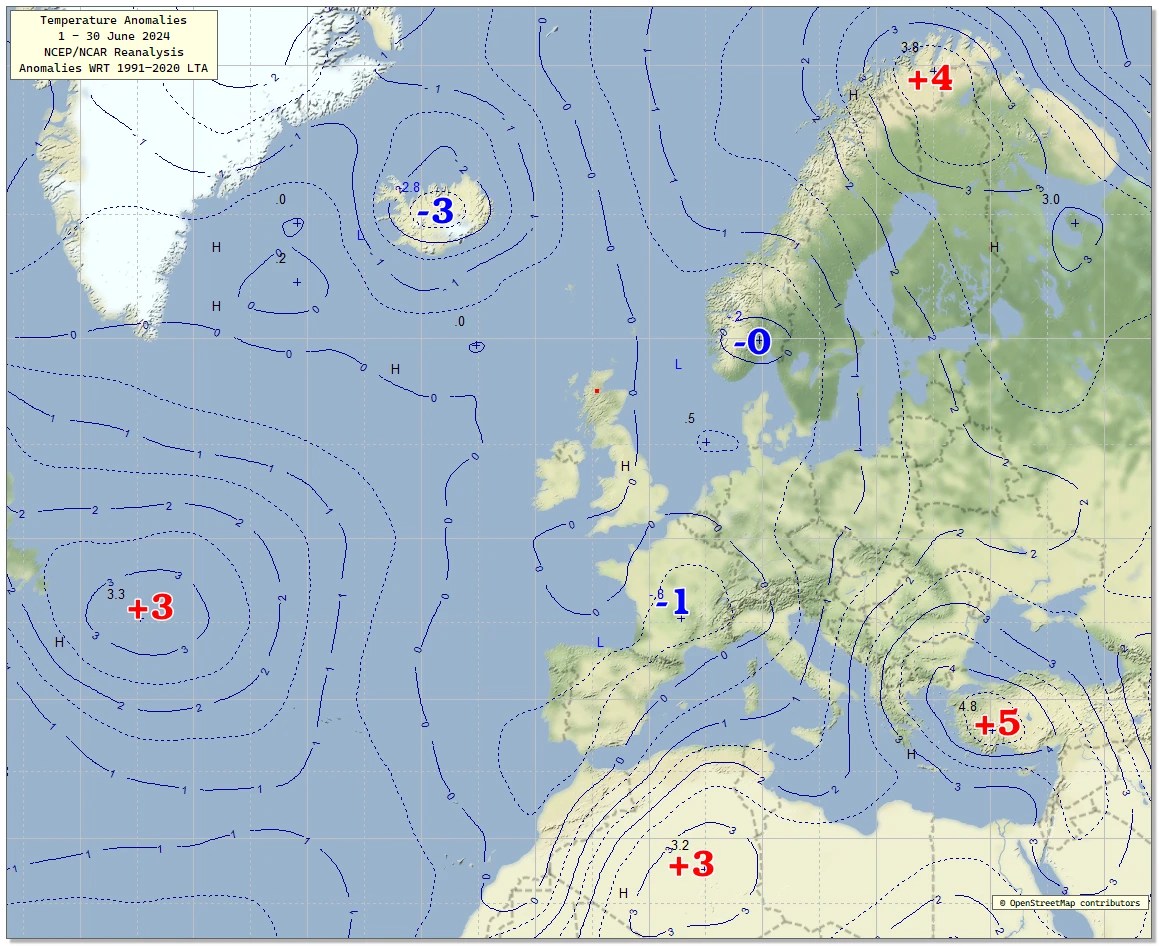
Mean temperatures were close to or a little below average across IONAIONA Islands Of North Atlantic. Yes I know there's an island called Iona, but this is so I don't have to use the term 'British Isles' when referring to the whole of Ireland and the UK.. A cold trough extended SSE from central Greenland, through Iceland and on into Iberia and southern France. Warmer than average air dominated the central Atlantic, and in a band running from northern Scandinavia, down into eastern Russia, Turkey and on into north Africa.

Anomalies, Global Temperatures, June

June 2024 – Mean Temperature anomalies Read More »

1 June 2024 – Latest daily global temperature anomalies

Latest ECMWFECMWF The European Centre for Medium-Range Weather Forecasts is an independent intergovernmental organisation supported by most of the nations of Europe. It is based at three sites: Shinfield Park, Reading, United Kingdom; Bologna, Italy; and Bonn, Germany. It operates one of the largest supercomputer complexes in Europe and the world's largest archive of numerical weather prediction data. global temperatures are still at record levels as of the 1st of June at +1.69°C above the pre-industrial LTALTA Long Term Average. This is usually defined as a 30 year period by the WMO. levels. I mistakenly thought that the demise of El NinoEl Niño El Niño 'The Boy' is the warm phase of the El Niño–Southern Oscillation and is associated with a band of warm ocean water that develops in the central and east-central equatorial Pacific this spring into the neutral zone might cool things down globally, but I was wrong again. We are now one year on from when this unprecedented surge in global temperatures began, and there’s little doubt that will mean 12 months of consecutive records.

ECMWF, Global Temperatures

1 June 2024 – Latest daily global temperature anomalies Read More »

Eleventh consecutive warmest month globally

My DIYDIY Do It Yourself global temperature series was wrong once again in April. It predicted a tie in global temperatures with April 2016, but shock horror, ERA5ERA ERA stands for 'ECMWF Re-Analysis' and refers to a series of research projects at ECMWF which produced various datasets (ERA-Interim, ERA-40, etcetera). reports an anomaly of +0.67°C, which is well above the +0.529°C of 2016 making it the eleventh consecutive warmest month. 😲
Below is a graph of 12 month moving average global temperature anomalies since April 1994 from seven of the world’s leading global temperature series. None of them are as quick of the mark at reporting their results like the ECMWFECMWF The European Centre for Medium-Range Weather Forecasts is an independent intergovernmental organisation supported by most of the nations of Europe. It is based at three sites: Shinfield Park, Reading, United Kingdom; Bologna, Italy; and Bonn, Germany. It operates one of the largest supercomputer complexes in Europe and the world's largest archive of numerical weather prediction data., but all show the recent surge that started at the beginning of 2023. The 30 year linear trend on the ERA5 series shows an increase of +0.24°C per decade over that time, and the warming trend that started in 1970 is starting to accelerate.

Global Temperatures, Global Warming

Eleventh consecutive warmest month globally Read More »

Scroll to Top